Appearance
Developer Tools
Basic functionality
Video sync
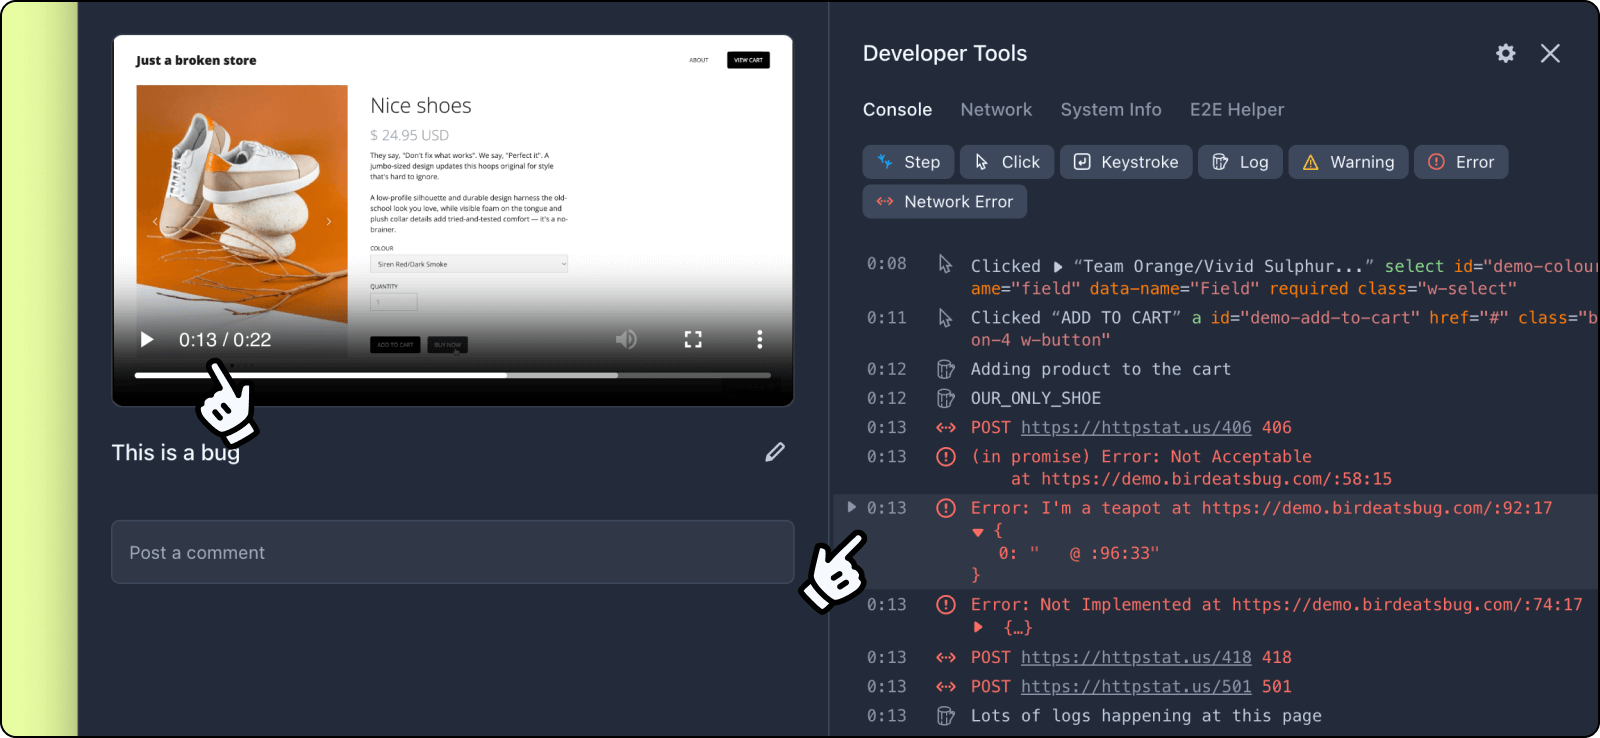
When you play a recording, the logs in the console will also scroll automatically so that you can see when certain error logs occur relative to the recording timeline.
This sync works 2-ways: when you click the timestamp to the left of a log, the recording will also skip to this timestamp.
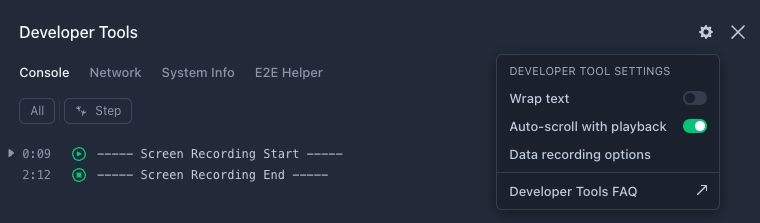
The automatic scrolling of the developer tools can be disabled in the developer tool options:
Highlight logs
Clicking a log in the console or network allows you to highlight them. More importantly, when you copy and share a bug report link with a log highlighted this way, whoever views your link will also see the highlight.
Console
Supported data types
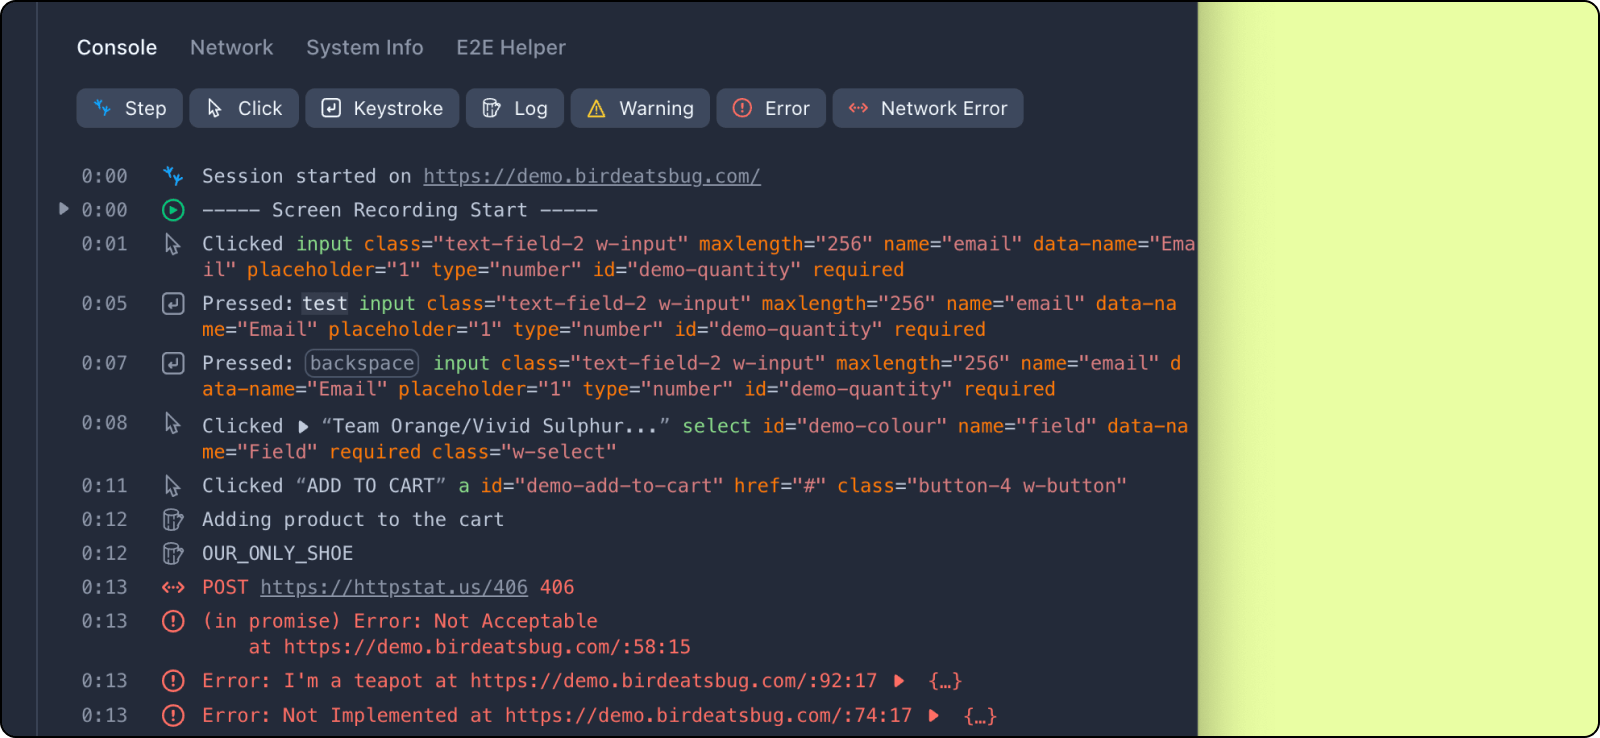
The following types of data can be captured and shown in the console:
- Steps: page navigation or recording actions e.g. start, stop, pause
- Click events that reach the document level are recorded
- Keystrokes that reach the document level are recorded
- Script errors
- Unhandled rejections
Console.debugConsole.logConsole.infoConsole.warnConsole.errorConsole.assertConsole.dir(xml)Console.tableConsole.traceConsole.group(Collapsed|End)*Console.count(Reset)*Console.profile(End)*Console.time(End|Log|Stamp)*localStorageupdates (set, remove, clear) **sessionStorageupdates (set, remove, clear) **
*Bird only records the method calls and not the output values because these methods could depend on context that the extension does not have (e.g. were console groups already opened before the session was started? Were counts already initiated before session recording began?). Also, they could trigger side-effects we don't have access to (profiles), or where computing the output would be plausible but imprecise (time method). Therefore, the console method calls shown only as they happened, without output. Knowing that these methods were called can be helpful to understand the executed code path, and thus help debugging issues.
**Bird records the method calls and the key-value pairs that were set, removed, or cleared. If the website being recorded is using custom localStorage or sessionStorage implementations, Bird might not record as expected.
Network
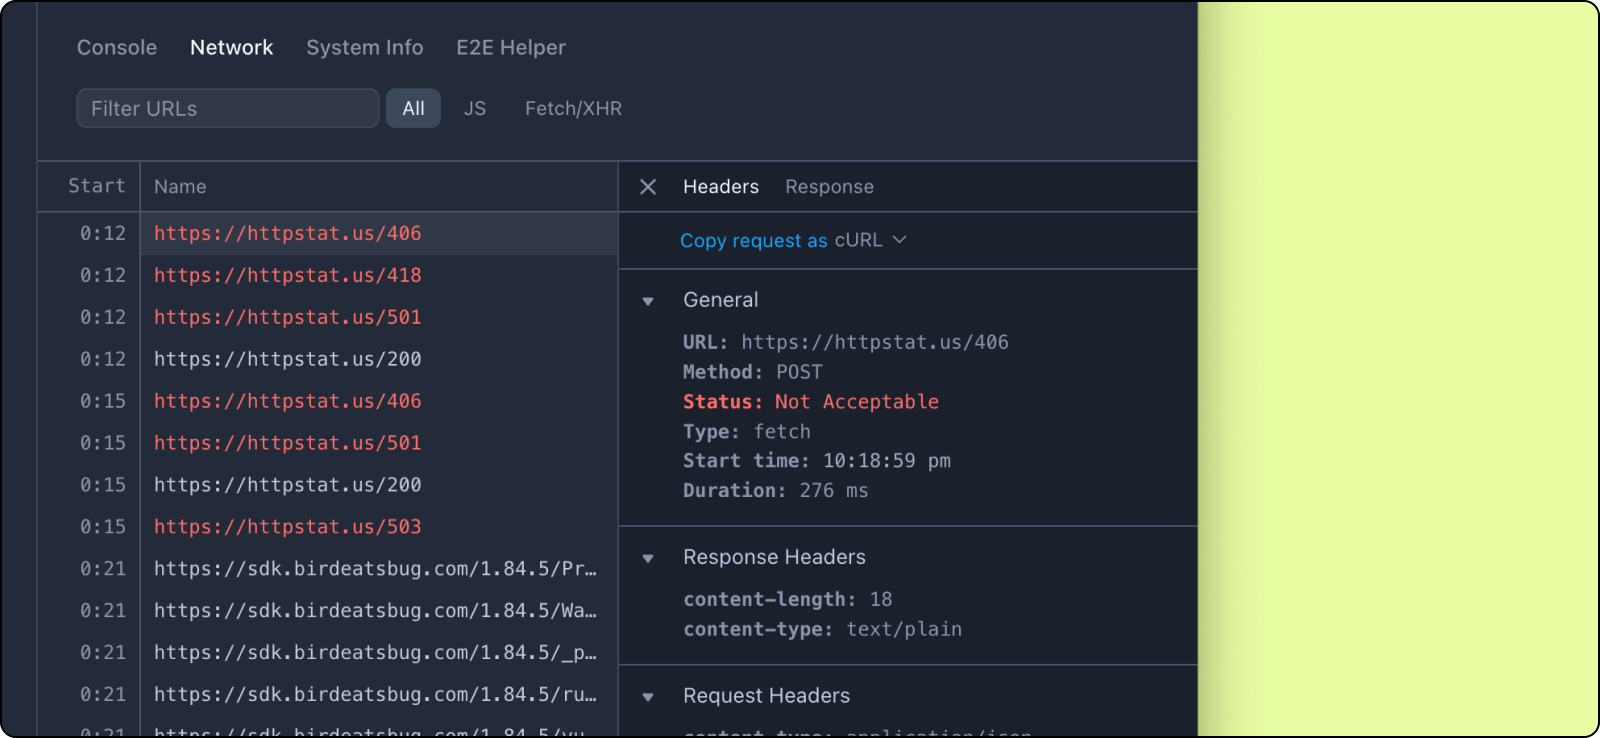
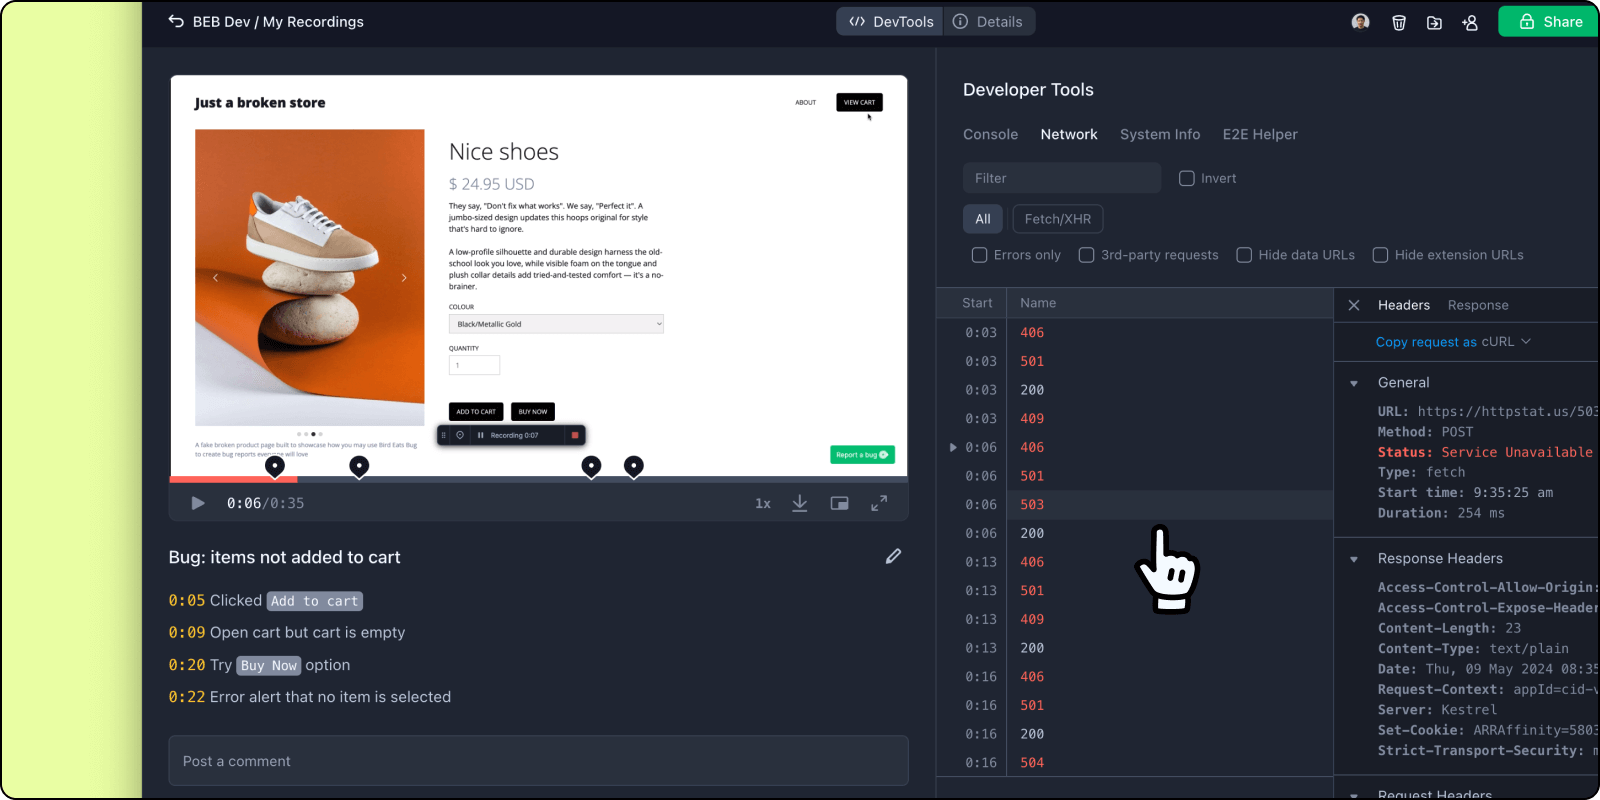
The Bird recorder captures Network requests, along with request responses for XMLHttpRequests and fetch requests. Capturing network requests is complex and therefore comes with some technical limitations, that have been documented here.
System Information
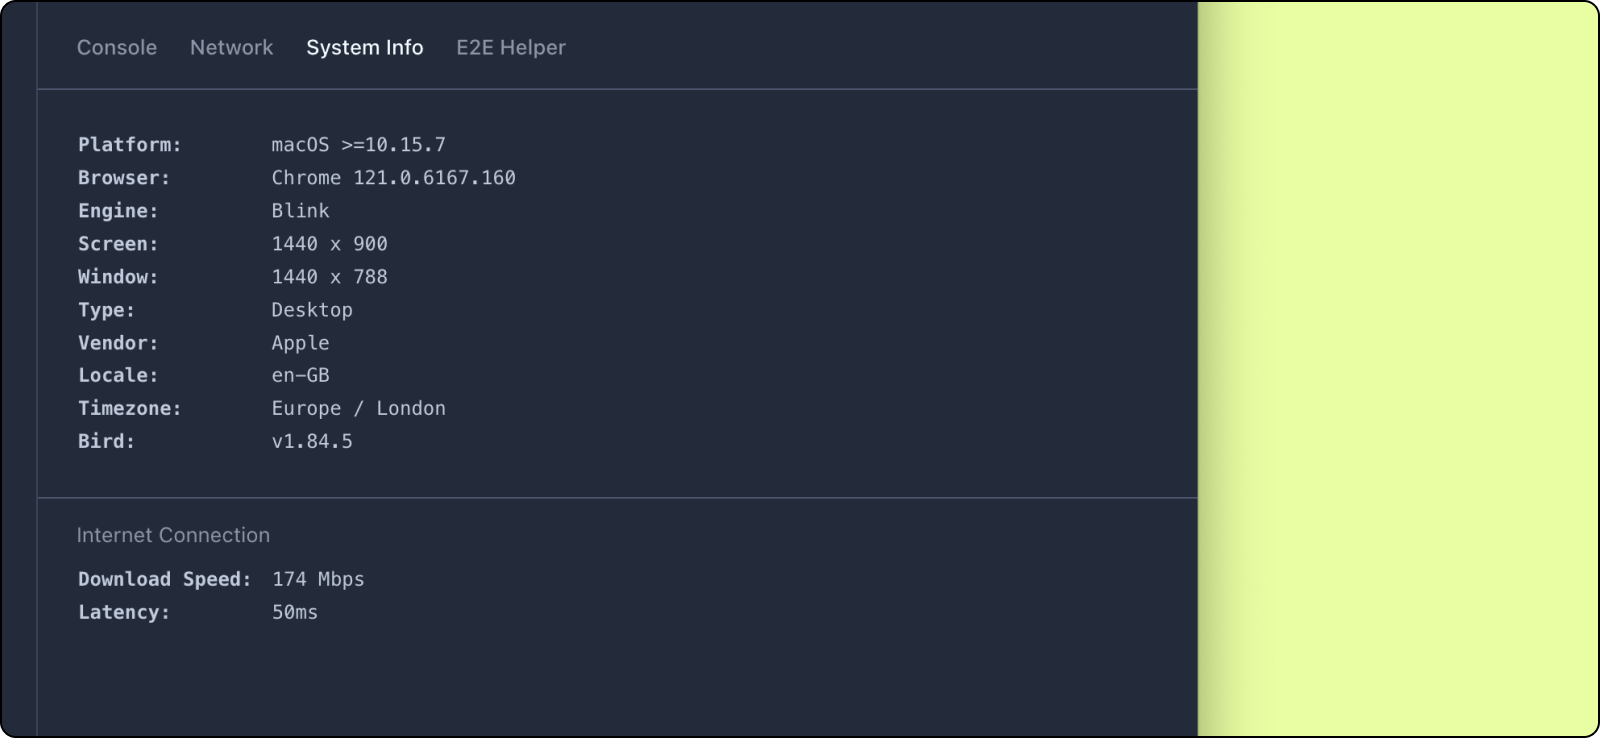
The Bird recorder can capture basic information about the system that the reporter records from, including the internet connection speed at the moment of upload, as shown in the image above.
For Platform, please note that as of MacOS version 10.15, Apple has limited the recording of the precise system version (more details here), so Bird is limited to only show that the MacOS version is later than 10.15.7.
End-to-End Helper
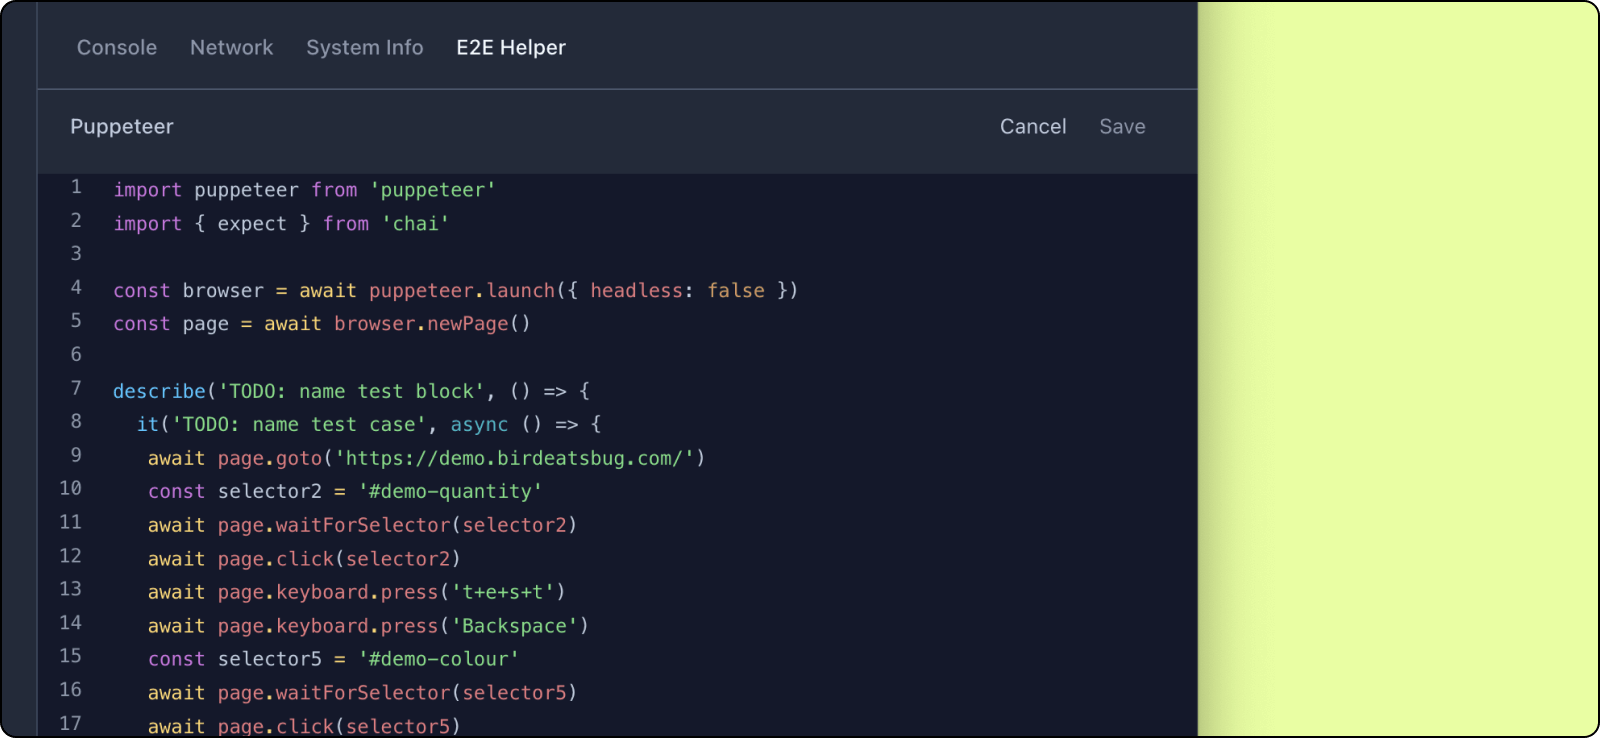
The E2E helper takes information from the recording (e.g. page navigation, clicks, keystrokes) and converts them into an end-to-end test script template. The combination of a screen recording and a test script template with specific actions is a very effective way to handover test cases for creating automated tests. An automation engineer can then use the templates as a starter for writing automated tests.
Supported testing frameworks
- Playwright
- Cypress
- Puppeteer
- Selenium
Framework/Library Support
When React or Vue.js components are logged from one of the mentioned console methods, they are rendered so that they are easy to understand.
The browser extension does not offer special recording abilities for state libraries like Redux, and instead focuses on providing most value independent of a site's specific tech-stack.
However, we have noticed that technical data recording on AMP pages is prone to missing technical data, due to the use of iFrames to wrap the main content.
Unsupported recording capabilities
The following types of data are currently not captured by our recorders:
- Changes to cookies
IndexedDB- Sourcemaps
- Recording of activity inside
iFramesembedded into the recorded page